

In Exercises 8788, we used the data in a bar graph to develop linear functions that modeled
Question:
In Exercises 87–88, we used the data in a bar graph to develop linear functions that modeled the percentage of never-married American females and males, ages 25–29. For this group exercise, you might find it helpful to pattern your work after Exercises 87 and 88. Group members should begin by consulting an almanac, newspaper, magazine, or the Internet to find data that appear to lie approximately on or near a line. Working by hand or using a graphing utility, group members should construct scatter plots for the data that were assembled. If working by hand, draw a line that approximately fits the data in each scatter plot and then write its equation as a function in slope-intercept form. If using a graphing utility, obtain the equation of each regression line. Then use each linear function’s equation to make predictions about what might occur in the future. Are there circumstances that might affect the accuracy of the prediction? List some of these circumstances.
Data from Exercise 87
Americans are getting married later in life, or not getting married at all. In 2010, more than half of Americans ages 25 through 29 were unmarried. The bar graph shows the percentage of never-married men and women in this age group for four selected years. The data are displayed as two sets of four points each, one scatter plot for the percentage of never-married American men and one for the percentage of never-married American women. Also shown for each scatter plot is a line that passes through or near the four points. Use these lines to solve Exercises 87–88. In this exercise, you will use the blue line for the women shown on the scatter plot to develop a model for the percentage of never-married American females ages 25–29.
Data from Exercise 88
Americans are getting married later in life, or not getting married at all. In 2010, more than half of Americans ages 25 through 29 were unmarried. The bar graph shows the percentage of never-married men and women in this age group for four selected years. The data are displayed as two sets of four points each, one scatter plot for the percentage of never-married American men and one for the percentage of never-married American women. Also shown for each scatter plot is a line that passes through or near the four points. Use these lines to solve Exercises 87–88.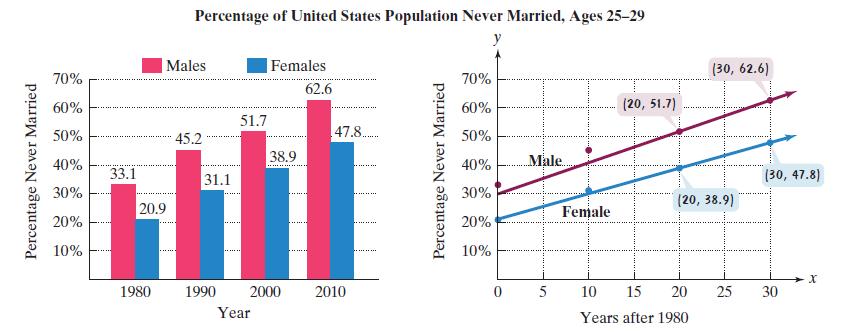 In this exercise, you will use the red line for the men shown on the scatter plot to develop a model for the percentage of never-married American males ages 25–29.
Step by Step Answer:

This question has not been answered yet.
You can Ask your question!


