

In more U.S. marriages, spouses have different faiths. The bar graph shows the percentage of households with
Question:
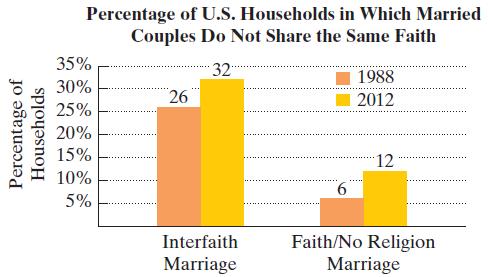
In more U.S. marriages, spouses have different faiths. The bar graph shows the percentage of households with an interfaith marriage in 1988 and 2012. Also shown is the percentage of households in which a person of faith is married to someone with no religion.
 The formula
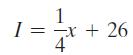 models the percentage of U.S. households with an interfaith marriage, I, x years after 1988. The formula
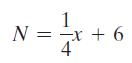 models the percentage of U.S. households in which a person of faith is married to someone with no religion, N, x years after 1988. Use these models to solve Exercises 117–118.
a. In which years will more than 33% of U.S. households have an interfaith marriage?b. In which years will more than 14% of U.S. households have a person of faith married to someone with no religion?c. Based on your answers to parts (a) and (b), in which years will more than 33% of households have an interfaith marriage and more than 14% have a faith/no religion marriage?d. Based on your answers to parts (a) and (b), in which years will more than 33% of households have an interfaith marriage or more than 14% have a faith/no religion marriage?
Step by Step Answer:
a b More than 14 of US households will have a person of faith ...View the full answer


