

The bar graph gives the life expectancy for American men and women born in six selected years.
Question:
The bar graph gives the life expectancy for American men and women born in six selected years. In Exercises 89–90, you will use the data to obtain models for life expectancy and make predictions about how long American men and women will live in the future.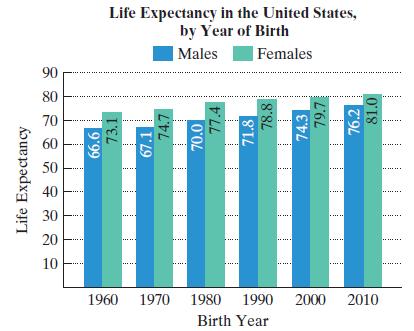 Use the data for females shown in the bar graph at the bottom of the previous column to solve this exercise.a. Let x represent the number of birth years after 1960 and let y represent female life expectancy. Create a scatter plot that displays the data as a set of six points in a rectangular coordinate system.b. Draw a line through the two points that show female life expectancies for 1970 and 2000. Use the coordinates of these points to write a linear function that models life expectancy, E(x), for American women born x years after 1960. Round the slope to two decimal places.c. Use the function from part (b) to project the life expectancy of American women born in 2020.
Step by Step Answer:
a b c Life Expectancy for Unit...View the full answer


