

The bar graph shows the population of the United States, in millions, for six selected years. a.
Question:
The bar graph shows the population of the United States, in millions, for six selected years.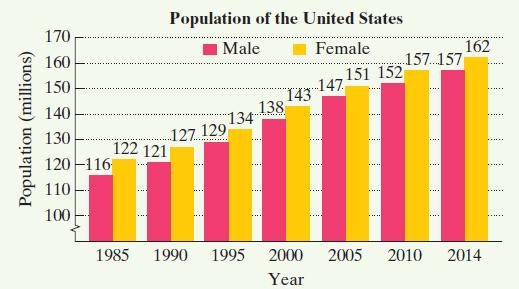
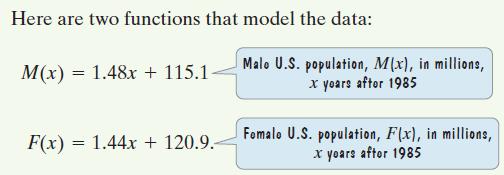
a. Write a function that models the total U.S. population, P(x), in millions, x years after 1985.
b. Write a rational function that models the fraction of men in the U.S. population, R(x), x years after 1985.
c. What is the equation of the horizontal asymptote associated with the function in part (b)? Round to two decimal places. What does this mean about the percentage of men in the U.S. population over time?
Fantastic news! We've Found the answer you've been seeking!
Step by Step Answer:
a b c Px ...View the full answer

Answered By
Patrick Busaka
I am a result oriented and motivated person with passion for challenges because they provide me an opportunity to grow professionally.
38+ Reviews
58+ Question Solved
Related Book For 

Question Posted:
