

The bar graph shows the total amount Americans paid in federal taxes, in trillions of dollars, and
Question:
The bar graph shows the total amount Americans paid in federal taxes, in trillions of dollars, and the U.S. population, in millions, from 2012 through 2015. Exercises 115–116 are based on the numbers displayed by the graph.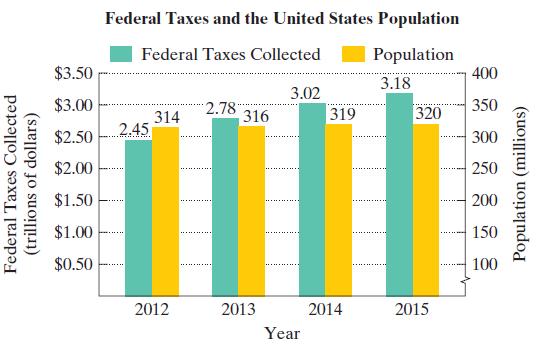
a. In 2014, the United States government collected $3.02 trillion in taxes. Express this number in scientific notation.
b. In 2014, the population of the United States was approximately 319 million. Express this number in scientific notation.
c. Use your scientific notation answers from parts (a) and (b) to answer this question: If the total 2014 tax collections were evenly divided among all Americans, how much would each citizen pay? Express the answer in decimal notation, rounded to the nearest dollar.
Fantastic news! We've Found the answer you've been seeking!
Step by Step Answer:
a 30210 12 b 3191...View the full answer

Answered By
Sidharth Jain
My name is Sidharth. I completed engineering from National Institute of Technology Durgapur which is one of the top college in India. I am currently working as an Maths Faculty in one of the biggest IITJEE institute in India. Due to my passion in teaching and Maths, I came to this field. I've been teaching for almost 3 years.
Apart from it I also worked as an Expert Answerer on Chegg.com. I have many clients from USA to whom I teach online and help them in their assignments. I worked on many online classes on mymathlab and webassign. I guarantee for grade 'A'.
3+ Reviews
10+ Question Solved
Related Book For 

Question Posted:
