

The bar graph shows your chances of surviving to various ages once you reach 60. The functions
Question:
The bar graph shows your chances of surviving to various ages once you reach 60.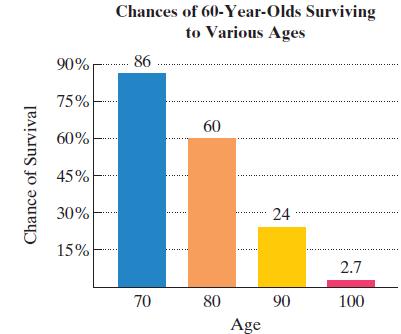 The functions
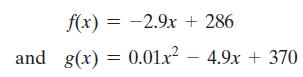 model the chance, as a percent, that a 60-year-old will survive to age x. Use this information to solve Exercises 101–102.
a. Find and interpret f(70).b. Find and interpret g(70).c. Which function serves as a better model for the chance of surviving to age 70?
Fantastic news! We've Found the answer you've been seeking!
Step by Step Answer:
a f 70 83 which means the chance that a ...View the full answer

Answered By
Ali Khawaja
my expertise are as follows: financial accounting : - journal entries - financial statements including balance sheet, profit & loss account, cash flow statement & statement of changes in equity -consolidated statement of financial position. -ratio analysis -depreciation methods -accounting concepts -understanding and application of all international financial reporting standards (ifrs) -international accounting standards (ias) -etc business analysis : -business strategy -strategic choices -business processes -e-business -e-marketing -project management -finance -hrm financial management : -project appraisal -capital budgeting -net present value (npv) -internal rate of return (irr) -net present value(npv) -payback period -strategic position -strategic choices -information technology -project management -finance -human resource management auditing: -internal audit -external audit -substantive procedures -analytic procedures -designing and assessment of internal controls -developing the flow charts & data flow diagrams -audit reports -engagement letter -materiality economics: -micro -macro -game theory -econometric -mathematical application in economics -empirical macroeconomics -international trade -international political economy -monetary theory and policy -public economics ,business law, and all regarding commerce
1+ Reviews
10+ Question Solved
Related Book For 

Question Posted:
