

The figure shows the graph of f(x) = ln x. In Exercises 6574, use transformations of this
Question:
The figure shows the graph of f(x) = ln x. In Exercises 65–74, use transformations of this graph to graph each function. Graph and give equations of the asymptotes. Use the graphs to determine each function’s domain and range.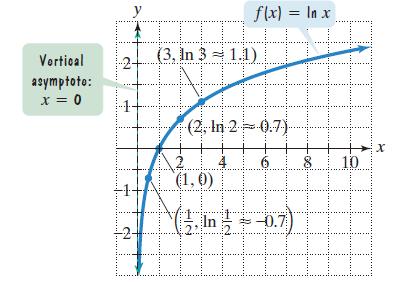 g(x) = 2 - ln x
Fantastic news! We've Found the answer you've been seeking!
Step by Step Answer:
YA 54 LAN In 1 2 ...View the full answer

Answered By
Joemar Canciller
I teach mathematics to students because I love to share what I have in this field.
I also want to see the students to love math and be fearless in this field.
I've been tutoring these past 2 years and I would like to continue what I've been doing.
1+ Reviews
10+ Question Solved
Related Book For 

Question Posted:
