

The figure shows the graphs of the cost and revenue functions for a company that manufactures and
Question:
The figure shows the graphs of the cost and revenue functions for a company that manufactures and sells small radios. Use the information in the figure to solve Exercises 55–60.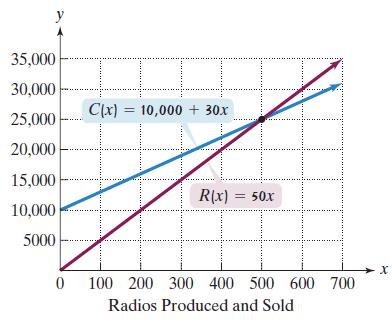
a. Use the formulas shown in the voice balloons to write the company’s profit function, P, from producing and selling x radios.
b. Find the company’s profit if 10,000 radios are produced and sold.
Fantastic news! We've Found the answer you've been seeking!
Step by Step Answer:
a b Px RxCx ...View the full answer

Answered By
PALASH JHANWAR
I am a Chartered Accountant with AIR 45 in CA - IPCC. I am a Merit Holder ( B.Com ). The following is my educational details.
PLEASE ACCESS MY RESUME FROM THE FOLLOWING LINK: https://drive.google.com/file/d/1hYR1uch-ff6MRC_cDB07K6VqY9kQ3SFL/view?usp=sharing
3+ Reviews
10+ Question Solved
Related Book For 

Question Posted:
