

The figure shows the healthy weight region for various heights for people ages 35 and older. If
Question:
The figure shows the healthy weight region for various heights for people ages 35 and older.
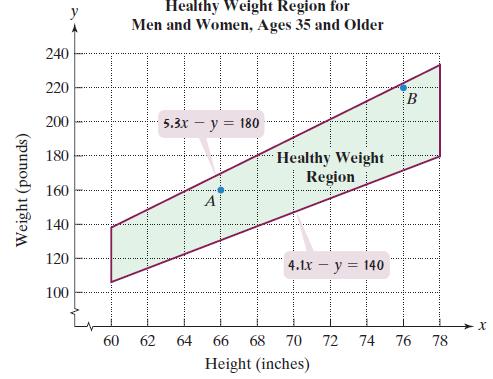 If x represents height, in inches, and y represents weight, in pounds, the healthy weight region can be modeled by the following system of linear inequalities:
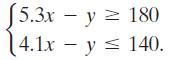 Use this information to solve Exercises 77–80.
Show that point A is a solution of the system of inequalities that describes healthy weight for this age group.
Fantastic news! We've Found the answer you've been seeking!
Step by Step Answer:
Point A 66160 53xy180 53...View the full answer

Answered By
Vivek Singh
I taught many places and know about the mental ability of young student. We make learnt them how to balance between study and many other important activities.
0 Reviews
10+ Question Solved
Related Book For 

Question Posted:
