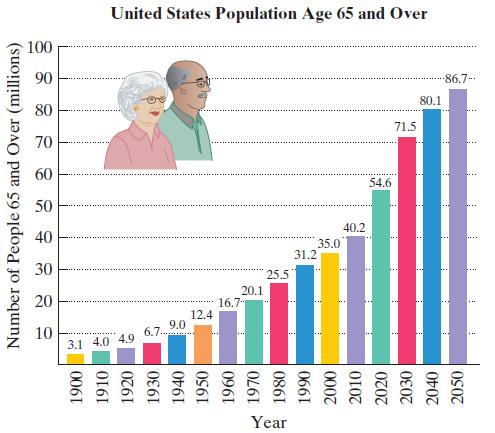
The figure shows the number of people in the United States age 65 and over, with projected
Question:
The figure shows the number of people in the United States age 65 and over, with projected figures for the year 2020 and beyond.
a. Let x represent the number of years after 1899 and let y represent the U.S. population age 65 and over, in millions. Use your graphing utility to find the model that best fits the data in the bar graph.
b. Rewrite the model in terms of base e. By what percentage is the 65 and over population increasing each year?
Fantastic news! We've Found the answer you've been seeking!
Step by Step Answer:
Related Book For 

Question Posted:


