

The following graph shows a weight and height chart. The weight w is listed in pounds and
Question:
The following graph shows a weight and height chart. The weight w is listed in pounds and the height h in inches. The shaded area is a recommended region.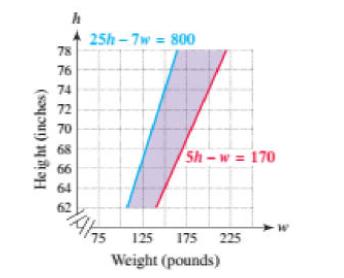 Explain why inequalities are more appropriate than equalities for describing recommended weight and height combinations.
Fantastic news! We've Found the answer you've been seeking!
Step by Step Answer:
There is no single ideal weight or h...View the full answer

Answered By
Keziah Thiga
I am a self motivated financial professional knowledgeable in; preparation of financial reports, reconciling and managing accounts, maintaining cash flows, budgets, among other financial reports. I possess strong analytical skills with high attention to detail and accuracy. I am able to act quickly and effectively when dealing with challenging situations. I have the ability to form positive relationships with colleagues and I believe that team work is great key to performance. I always deliver quality, detailed, original (0% plagirism), well-researched and critically analyzed papers.
1504+ Reviews
2897+ Question Solved
Related Book For 

College Algebra With Modeling And Visualization
ISBN: 9780134418049
6th Edition
Authors: Gary Rockswold
Question Posted:
