

The graph illustrates home temperature, f(t), as a function of hours after midnight, t. In Exercises 137140,
Question:
The graph illustrates home temperature, f(t), as a function of hours after midnight, t.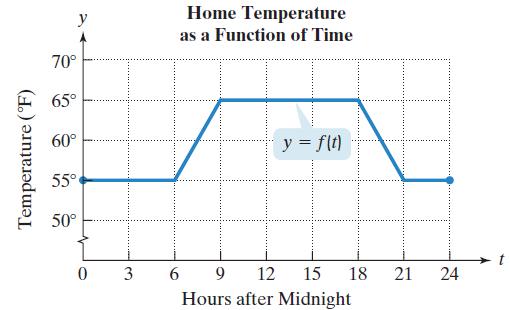 In Exercises 137–140, determine whether each statement makes sense or does not make sense, and explain your reasoning. If the statement makes sense, graph the new function on the domain [0, 24]. If the statement does not make sense, correct the function in the statement and graph the corrected function on the domain [0, 24].
I decided to keep the house 5° warmer than before, so I reprogrammed the thermostat to y = f(t) + 5.
Fantastic news! We've Found the answer you've been seeking!
Step by Step Answer:
To determine if the statement makes sense or not we need to examine the ...View the full answer

Answered By
Anik Kumar Bosu
I am expert in Maths, Physics, Chemistry and Biology. I also teach student from 3 years. Students becomes satisfied by my teaching. So, do not worry.
0 Reviews
10+ Question Solved
Related Book For 

Question Posted:
