

The graph shows that from 2000 through 2006, Americans unplugged land lines and switched to cellphones. a.
Question:
The graph shows that from 2000 through 2006, Americans unplugged land lines and switched to cellphones.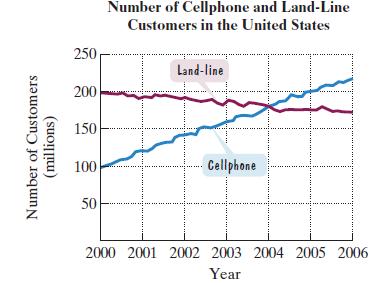
a. Use the graphs to estimate the point of intersection. In what year was the number of cellphone and land-line customers the same? How many millions of customers were there for each?
b. The function 4.3x + y = 198 models the number of land-line customers, in millions, x years after 2000. The function y = 19.8x + 98 models the number of cellphone customers, in millions, x years after 2000. Use these models to determine the year, rounded to the nearest year, when the number of cellphone and land-line customers was the same. According to the models, how many millions of customers, rounded to the nearest ten million, were there for each?
c. How well do the models in part (b) describe the point of intersection of the graphs that you estimated in part (a)?
Step by Step Answer:
a Answers will vary Approximate point is 2004180 This means that in 2004 the number of cellphones and landlines were both 180 million b c The models describe the point of intersection quite well Using substitution 43x y 198 y 43x198x98 43x198x98 198 198 241x 98 198 241x 100 x4 The number of cellphone ...View the full answer


