

The graph shows the amount of water in a 100-gallon tank after x minutes have elapsed. (a)
Question:
The graph shows the amount of water in a 100-gallon tank after x minutes have elapsed.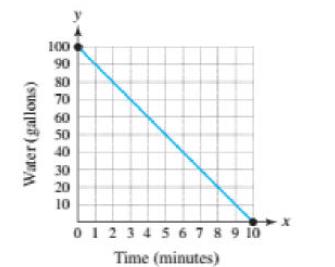
(a) Is water entering or leaving the tank? How much water is in the tank after 3 minutes?
(b) Find both the x- and y-intercepts. Interpret each intercept.
(c) Find the slope-intercept form of the equation of the line. Interpret the slope.
(d) Use the graph to estimate the x-coordinate of the point (x, 50) that lies on the line.
Fantastic news! We've Found the answer you've been seeking!
Step by Step Answer:
a Water is leaving the tank because the amount of water in the ...View the full answer

Answered By
Bhartendu Goyal
Professional, Experienced, and Expert tutor who will provide speedy and to-the-point solutions. I have been teaching students for 5 years now in different subjects and it's truly been one of the most rewarding experiences of my life. I have also done one-to-one tutoring with 100+ students and help them achieve great subject knowledge. I have expertise in computer subjects like C++, C, Java, and Python programming and other computer Science related fields. Many of my student's parents message me that your lessons improved their children's grades and this is the best only thing you want as a tea...
2+ Reviews
10+ Question Solved
Related Book For 

College Algebra With Modeling And Visualization
ISBN: 9780134418049
6th Edition
Authors: Gary Rockswold
Question Posted:
