

The line graph shows the cost of inflation. What cost $10,000 in 1984 would cost the amount
Question:
The line graph shows the cost of inflation. What cost $10,000 in 1984 would cost the amount shown by the graph in subsequent years.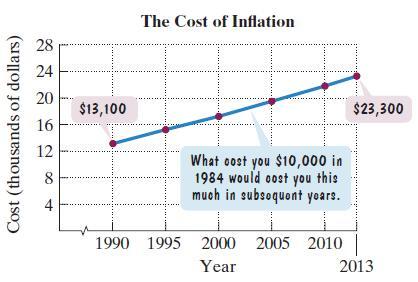
Here are two mathematical models for the data shown by the graph. In each formula, C represents the cost x years after 1990 of what cost $10,000 in 1984.
a. Use the graph to estimate the cost in 2010, to the nearest thousand dollars, of what cost $10,000 in 1984.
b. Use model 1 to determine the cost in 2010. How well does this describe your estimate from part (a)?![]() c. Use model 2 to determine the cost in 2010. How well does this describe your estimate from part (a)?
c. Use model 2 to determine the cost in 2010. How well does this describe your estimate from part (a)?![]()
Fantastic news! We've Found the answer you've been seeking!
Step by Step Answer:
a What cost 10000 in 1984 would cost abo...View the full answer

Answered By
Muhammad Umair
I have done job as Embedded System Engineer for just four months but after it i have decided to open my own lab and to work on projects that i can launch my own product in market. I work on different softwares like Proteus, Mikroc to program Embedded Systems. My basic work is on Embedded Systems. I have skills in Autocad, Proteus, C++, C programming and i love to share these skills to other to enhance my knowledge too.
1+ Reviews
10+ Question Solved
Related Book For 

Question Posted:
