

The table at the top of the next column shows approximate global sales in millions of cars
Question:
The table at the top of the next column shows approximate global sales in millions of cars with self-driving features, such as remote valet assistant and autopilot with lane-changing.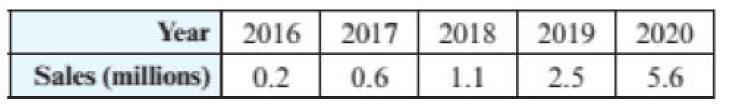
(a) Discuss the general trend in sales during this time period.
(b) Would a linear function model this data well? Explain.
(c) What other type of function might work?
(d) If a parabola is used to model this data, will it open upward or downward? Explain.
(e) Find a quadratic function S that models the data.
(f) Estimate the number of cars sold in 2015 and compare it with the actual value of 0.14 million. Did your estimate use interpolation or extrapolation? Explain why this estimate is inaccurate.
Step by Step Answer:
a The number of sales increased but not at a constan...View the full answer


College Algebra With Modeling And Visualization
ISBN: 9780134418049
6th Edition
Authors: Gary Rockswold
