

The table shows the average cost of tuition and fees y in dollars at 4-year public colleges.
Question:
The table shows the average cost of tuition and fees y in dollars at 4-year public colleges. In this table x = 0 represents 1980 and x = 20 corresponds to 2000.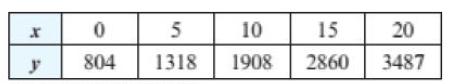
These data can be modeled by using linear regression. Ideally, we would like f(x) = ax + b to satisfy the following five equations.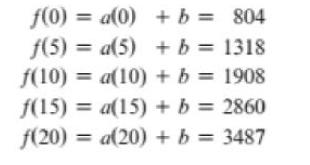
Since the data points are not collinear, it is impossible for the graph of a line to pass through all five points. These five equations can be written as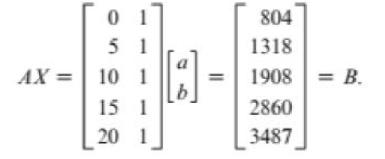
The least-squares solution is found by solving the normal equations![]()
for X. The solution is X= (ATA)-1ATB. Using technology, we find a = 138.16 and b = 693.8. Thus f is given by the formula f(x) = 138.16x + 693.8. The function f and the data can be graphed. See the figure.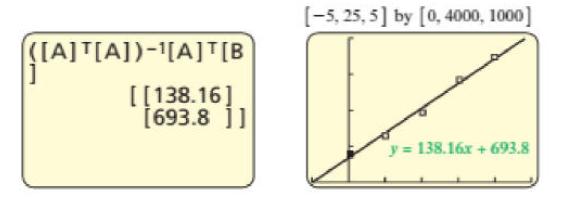
Solve the normal equations to model the data with the line determined by f(x) = ax + b. Plot the data and f in the same viewing rectangle.
The table lists the number of satel- lite television subscribers y in millions. In this table x = 0 corresponds to 1995 and x = 5 to the year 2000.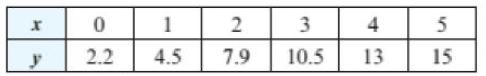
Step by Step Answer:
Start by forming the following matrix equation AX B 1 21 3 1 4 1 1 5 1 To find the leasts...View the full answer


College Algebra With Modeling And Visualization
ISBN: 9780134418049
6th Edition
Authors: Gary Rockswold
