

The table shows the distance y in miles traveled by a vehicle using x gallons of gasoline.
Question:
The table shows the distance y in miles traveled by a vehicle using x gallons of gasoline.
(a) Calculate the slopes of the line segments that connect consecutive points.
(b) Find a linear function f that models the data.
(c) Graph f and the data together. What does the slope indicate?
(d) Evaluate f(30) and interpret the result.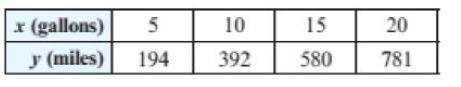
Fantastic news! We've Found the answer you've been seeking!
Step by Step Answer:
a b c d 5194 10 392 sl...View the full answer

Answered By
Shital Kale
I have done master degree in chemistry
Teaching experience in college and I had also worked in pharmaceutical company
0 Reviews
10+ Question Solved
Related Book For 

College Algebra With Modeling And Visualization
ISBN: 9780134418049
6th Edition
Authors: Gary Rockswold
Question Posted:
