

Use a calculator with an e x key to solve Exercises 7176. The bar graph shows the
Question:
Use a calculator with an ex key to solve Exercises 71–76. The bar graph shows the percentage of U.S. high school seniors who applied to more than three colleges for selected years from 1980 through 2013.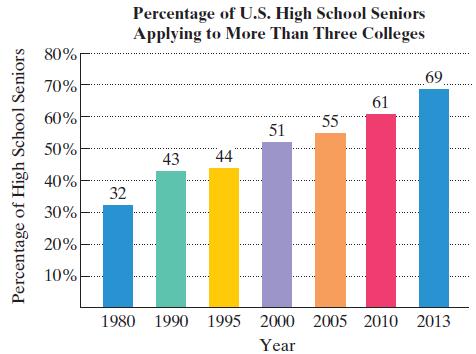 The data can be modeled by f(x) = x + 31 and g(x) = 32.7e0.0217x, in which f(x) and g(x) represent the percentage of high school seniors who applied to more than three colleges x years after 1980. Use these functions to solve Exercises 71–72. Where necessary, round answers to the nearest percent.
a. According to the linear model, what percentage of high school seniors applied to more than three colleges in 2010?
b. According to the exponential model, what percentage of high school seniors applied to more than three colleges in 2010?
c. Which function is a better model for the data shown by the bar graph in 2010?
Step by Step Answer:
a b c The linear model is the better ...View the full answer


