

What age groups are expected to be involved in 10 fatal crashes per 100 million miles driven?
Question:
What age groups are expected to be involved in 10 fatal crashes per 100 million miles driven? How well does the formula model the trend in the actual data shown in the bar graph?
A driver’s age has something to do with his or her chance of getting into a fatal car crash. The bar graph shows the number of fatal vehicle crashes per 100 million miles driven for drivers of various age groups. For example, 25-year-old drivers are involved in 4.1 fatal crashes per 100 million miles driven. Thus, when a group of 25-year-old Americans have driven a total of 100 million miles, approximately 4 have been in accidents in which someone died.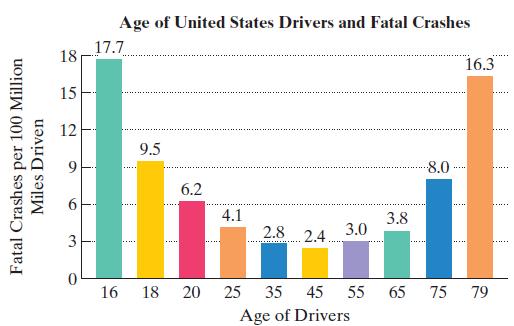 The number of fatal vehicle crashes per 100 million miles, N, for drivers of age x can be modeled by the formula
![]()
Step by Step Answer:
fx0013x 119x2824 100013x 119x2824 00013x 119x1824 a ...View the full answer


