

Expenditures for home health care in the United States are shown in the graph. (a) If a
Question:
Expenditures for home health care in the United States are shown in the graph.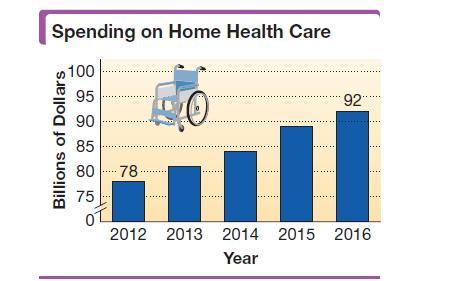
(a) If a straight line were drawn through the tops of the bars for 2012 and 2016, would this line have positive or negative slope? Explain.(b) Use the information given for the years 2012 and 2016, letting x = 12 represent 2012 and x = 16 represent 2016, and letting y represent spending (in billions of dollars), to write an equation that models the data.(c) Use the equation from part (b) to approximate the amount spent on home health care in 2015. How does the result compare with the actual value, $89 billion?
Fantastic news! We've Found the answer you've been seeking!
Step by Step Answer:
a If a line is drawn from the tops of the bars for 2012 and 2016 this line will have a ...View the full answer

Answered By
PRITAM SINGH
I have completed my Bachelors degree in 2021 in the subject Chemistry from Cotton University located in Guwahati. At present, I am pursuing my Masters degree in Chemistry at the same University and I'm in my final year now. I have good knowledge in the field of chemicals and procedures regarding this Subject and I also feel quite comfortable in Math, especially Algebra. I don't have much teaching experience but I am quite confident and fired up to tutor students in my field of expertise.
0 Reviews
10+ Question Solved
Related Book For 

Intermediate Algebra
ISBN: 9780134895987
13th Edition
Authors: Margaret Lial, John Hornsby, Terry McGinnis
Question Posted:
