

Given the graph of y = g(x) in the figure, sketch the graph of each function, and
Question:
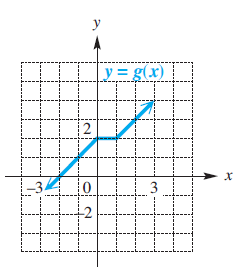
Given the graph of y = g(x) in the figure, sketch the graph of each function, and describe how it is obtained from the graph of y = g(x).
(a) y = g(-x)
(b) y = g(x - 2)
(c) y = -g(x)
(d) y = -g(x) + 2
Fantastic news! We've Found the answer you've been seeking!
Step by Step Answer:
a y gx The graph of gx is reflected across the yaxis ...View the full answer

Answered By
Arun kumar
made more than four thousand assignments
3+ Reviews
10+ Question Solved
Related Book For 

College Algebra
ISBN: 978-0134697024
12th edition
Authors: Margaret L. Lial, John Hornsby, David I. Schneider, Callie Daniels
Question Posted:
