Graph the function. Give the domain and range. +2 - 1 f(x) =
Question:
Graph the function. Give the domain and range.
Transcribed Image Text:
х+2 Ө"- – 1 f(x) =
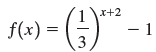
Fantastic news! We've Found the answer you've been seeking!
Step by Step Answer:
Answer rating: 80% (10 reviews)
The graph of is obtained ...View the full answer
Answered By
Dharmendra prajapati
having experience of teaching to academic students in the area of accountancy and finance.
0.00
0 Reviews
10+ Question Solved
Related Book For
College Algebra
ISBN: 978-0134697024
12th edition
Authors: Margaret L. Lial, John Hornsby, David I. Schneider, Callie Daniels
Question Posted:
Students also viewed these Mathematics questions
-
Graph the function. Give the domain and range. (x) = (log 2 x) + 3
-
Graph the function. Give the domain and range. (x) = log 2 (x + 3)
-
Graph the function. Give the domain and range. (x) = |log 2 (x + 3)|
-
In April 2016, Vanessa bought 100 shares in Entagon plc at a cost of 5 per share. The company went into liquidation and Vanessa received a first distribution of 40p per share in July 2020. The shares...
-
You were recently hired to improve the financial condition of Idaho Springs Hardware, a small chain of three hardware stores in Colorado. On your first day the owner, Chuck Vitaska, told you that the...
-
Given the accompanying sample data, use Excels formula options to find the 90% confidence interval for the population mean. Assume that the population is normally distributed and that the population...
-
Describing Findings in an ,^greed-Upon Procedures Engagement Agreed-upon procedures engagements on elements, accounts, or items of a financial statement and on nonfinancial statement assertions...
-
Ultra Day Spa provided $120,000 of services during 2016. All customers paid for the services with credit cards. Ultra submitted the credit card receipts to the credit card company immediately. The...
-
1. If a 3 3 matrix A has det(A) = 1, find det (A), det(-A), det(A), and det(A).
-
Given in the following table are the tasks necessary for the assembly of Fine Cedar Chests, the length of time needed to perform each task, and the operations that must be completed prior to...
-
Graph the function. Give the domain and range.
-
Graph the function. Give the domain and range. x+3 2 f(x) =
-
On September 1, 2014, Oxford Corp. sold at 102 (plus accrued interest) 5,200 of its $1,000 face value, 10-year, 9%, non-convertible bonds with detachable stock warrants. Each bond carried two...
-
Multiply. 864 3 C 3c 15c 2b Simplify your answer as much as possible.
-
Write the expression as one logarithm. 5 loga x + 3 * loga(x 9) 7 log,(5x + 8)
-
Multiply. 7 12 20 49 7 12 20 49 = (Type an integer or a simplified fraction.)
-
There you are University (TU) has procured a grant to improve health, largely because they are in the top five states for obesity in the country (much, much fried food and butter). The university has...
-
The population of Detroit has decreased 34% over the past 20 years. Today there are only 675,000 people in the city. What was the population 20 years ago? Round to the nearest person.
-
The device shown is used to mix soils in order to provide in-situ stabilization. If the mixer is connected to an A-36 steel tubular shaft that has an inner diameter of 3 in. and an outer diameter of...
-
A researcher reports a significant two-way between-subjects ANOVA, F(3, 40) = 2.96. State the decision to retain or reject the null hypothesis for this test.
-
Find C and a so that f(x) = Ca x models the situation described. State what the variable x represents in your formula. Home Value In 2015 a house was worth $200,000, and its value decreases by 5%...
-
Find f -1 (x). f(x) = x + 5
-
Decide if the situation could be modeled by a one-to-one function. The U.S. population from 1980 to 2010
-
2-Using the CPT data in figure below, a unit weight of 115 pcf, and an overconsolidation ratio of 3, determine (a) soil behavior type (b) o' using Kulhawy and Mayne correlation and (c) N60 for the...
-
How does the application of computational fluid dynamics (CFD) coupled with multiphase flow modeling enhance the understanding and prediction of complex hydrodynamic behaviors in industrial-scale...
-
1. From the joint distribution defined by the graphical model, determine if the conditional independence holds: ALL FIE, B, and provide brief explanation (5 points). 2. Given an undirected chain...
Study smarter with the SolutionInn App