In Problems 2330, use a graphing utility to graph each polynomial function f. Follow Steps 1 through
Question:
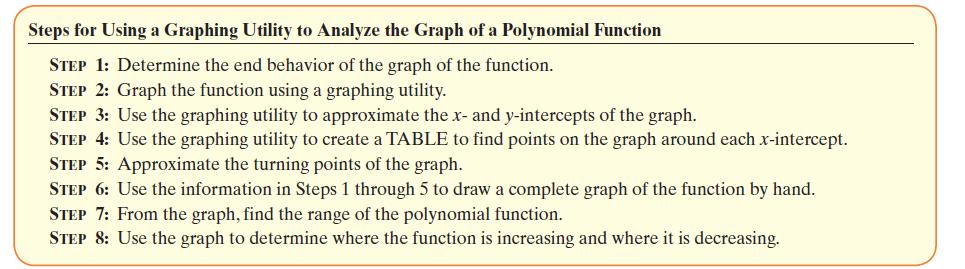
In Problems 23–30, use a graphing utility to graph each polynomial function f. Follow Steps 1 through 8.
Transcribed Image Text:
Steps for Using a Graphing Utility to Analyze the Graph of a Polynomial Function STEP 1: Determine the end behavior of the graph of the function. STEP 2: Graph the function using a graphing utility. STEP 3: Use the graphing utility to approximate the x- and y-intercepts of the graph. STEP 4: Use the graphing utility to create a TABLE to find points on the graph around each x-intercept. STEP 5: Approximate the turning points of the graph. STEP 6: Use the information in Steps 1 through 5 to draw a complete graph of the function by hand. STEP 7: From the graph, find the range of the polynomial function. STEP 8: Use the graph to determine where the function is increasing and where it is decreasing.
Fantastic news! We've Found the answer you've been seeking!
Step by Step Answer:
Answer rating: 60% (5 reviews)
fx x 256x 331x089 Step 1 Degree 3 The graph of the function resembl...View the full answer
Answered By
Usman Nasir
I did Master of Commerce in year 2009 and completed ACCA (Association of Chartered Certified Accountants) in year 2013. I have 10 years of practical experience inclusive of teaching and industry. Currently i am working in a multinational company as finance manager and serving as part time teacher in a university. I have been doing tutoring via many sites. I am very strong at solving numerical / theoretical scenario-based questions.
4.60+
16+ Reviews
28+ Question Solved
Related Book For
Question Posted:
Students also viewed these Mathematics questions
-
In Problems 2330, use a graphing utility to graph each polynomial function f. Follow Steps 1 through 8. Steps for Using a Graphing Utility to Analyze the Graph of a Polynomial Function STEP 1:...
-
In Problems 2330, use a graphing utility to graph each polynomial function f. Follow Steps 1 through 8. Steps for Using a Graphing Utility to Analyze the Graph of a Polynomial Function STEP 1:...
-
In Problems 2330, use a graphing utility to graph each polynomial function f. Follow Steps 1 through 8. Steps for Using a Graphing Utility to Analyze the Graph of a Polynomial Function STEP 1:...
-
In Figure 3-4, the current position of the demand curve is D 1 , and the price of a wireless earbud, which is a normal good, is $3. If there is an increase in consumer incomes, will the demand curve...
-
What skills will you need to work effectively in (1) a network organization; (2) a learning organization; (3) a high-involvement organization? Be specific and generate lists. Would you enjoy working...
-
A college student frequents one of two coffee houses on campus, choosing Starbucks 70% of the time and Peet's 30% of the time. Regardless of where she goes, she buys a cafe mocha on 60% of her...
-
How many forms of main() are there?
-
The following table provides the Dow Jones Industrial Average (DJIA) opening index value on the first working day of 1991-2010: Develop a trend line and use it to predict the opening DJIA index value...
-
40-watt bulbs are priced at 3 bulbs for $8. 100-watt bulbs are priced at 2 bulbs for $10. Assume that you had $52 and then bought 4 100-watt bulbs. What is the maximum number of 40-watt bulbs that...
-
In Problems 2125, solve each inequality. Graph the solution set. x 3 + x 2 < 4x + 4
-
In Problems 750, follow Steps 1 through 7. Steps for Graphing a Rational Function R STEP 1: Factor the numerator and denominator of R. Find the domain of the rational function. STEP 2: Write R in...
-
Presented below and on the next page is the balance sheet of Rasheed Brothers Corporation (000s omitted). InstructionsEvaluate the balance sheet presented. State briefly the proper treatment of any...
-
Immediately following World War II, the quality of products produced by Japanese companies was not good enough to compete in the international marketplace. The only advantage Japanese companies had...
-
Compute the present value of a $100 investment to be made 6 months, 5 years, and 10 years from now at 4 percent interest. Explain why the present value is lower the further into the future the...
-
A professional baseball team set its sights on winning the World Series. The team owner wanted to win big and win fast. Consequently, the team sank all of its resources into trading for the best...
-
Suppose you identify 10 possible investments whose payoffs are completely independent of one another. All the investments have the same expected value and standard deviation. You have $1,000 to...
-
We have too much conflict in this organization, said Larry Parette. Nobody agrees on anything. Its beginning to get to me. Nonsense, Larry, said Mack Porter. We need conflict. Our best ideas come...
-
A random sample of 22 lawn mowers was selected, and the motors were tested to see how many miles per gallon of gasoline each one obtained. The variance of the measurements was 2.6. Find the 95%...
-
Refer to the table to answer the following questions. Year Nominal GDP (in billions) Total Federal Spending (in billions) Real GDP (in billions) Real Federal Spending (in billions) 2000 9,817 578...
-
One side of the Eiffel Tower in Paris has a shape that can be approximated by the graph of the function where x and (x) are both measured in feet. (a) Why does the shape of the left side of the graph...
-
Solve each application. One action that government could take to reduce carbon emissions into the atmosphere is to levy a tax on fossil fuel. This tax would be based on the amount of carbon dioxide...
-
Radiative forcing, R, measures the influence of carbon dioxide in altering the additional solar radiation trapped in Earths atmosphere. The International Panel on Climate Change (IPCC) in 1990...
-
Empathy, Have a plan, focus on improving and maximizing lifetime value of customer, surround with great people, and always look for new opportunities Which of these do YOU find most compelling and...
-
Calculate the following ratios from the balance sheet given below: i. Debt Equity Ratio ii. Quick Ratio iii. Fixed Assets to Current Assets iv. Fixed Assets Turnover Balance Sheet Liabilities $...
-
Last year Interchange Inc. had sales of $495,000, based on a unit selling price of $225. The variable cost per unit was $175, and fixed costs were $105,000. The maximum sales within Interchange...
Study smarter with the SolutionInn App