

Let C be the function whose graph is given below. This graph represents the cost C of
Question:
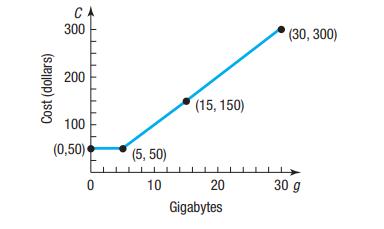
Let C be the function whose graph is given below. This graph represents the cost C of using g gigabytes of data in a month for a data-only plan.
(a) Find C (0). Interpret this value.
(b) Find C (5). Interpret this value.
(c) Find C (15). Interpret this value.
(d) What is the domain of C? What does this domain imply in terms of the number of gigabytes?
(e) Describe the shape of the graph.
Fantastic news! We've Found the answer you've been seeking!
Step by Step Answer:
a b c d e ...View the full answer

Answered By
PALASH JHANWAR
I am a Chartered Accountant with AIR 45 in CA - IPCC. I am a Merit Holder ( B.Com ). The following is my educational details.
PLEASE ACCESS MY RESUME FROM THE FOLLOWING LINK: https://drive.google.com/file/d/1hYR1uch-ff6MRC_cDB07K6VqY9kQ3SFL/view?usp=sharing
3+ Reviews
10+ Question Solved
Related Book For 

Question Posted:
