

Solve each problem. The graph shows the gallons of gasoline y in the gas tank of a
Question:
Solve each problem.
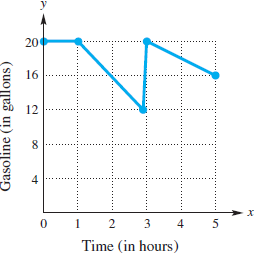
The graph shows the gallons of gasoline y in the gas tank of a car after x hours.
(a) Estimate how much gasoline was in the gas tank when x = 3.
(b) When did the car burn gasoline at the greatest rate?
Gasoline Use
Fantastic news! We've Found the answer you've been seeking!
Step by Step Answer:
a There were 20 gallons of gas ...View the full answer

Answered By
Ayush Mishra
I am a certified online tutor, with more than 3 years of experience in online tutoring. My tutoring subjects include: Physics, Mathematics and Mechanical engineering. I have also been awarded as best tutor for year 2019 in my previous organisation. Being a Mechanical Engineer, I love to tell the application of the concepts of science and mathematics in the real world. This help students to develop interest and makes learning fun and easy. This in turn, automatically improves their grades in the subject. I teach students to get prepared for college entry level exam. I also use to teach undergraduate students and guide them through their career aim.
2+ Reviews
10+ Question Solved
Related Book For 

College Algebra
ISBN: 978-0134697024
12th edition
Authors: Margaret L. Lial, John Hornsby, David I. Schneider, Callie Daniels
Question Posted:
