

The bar graph shows numbers of leisure trips within the United States (in millions of person-trips of
Question:
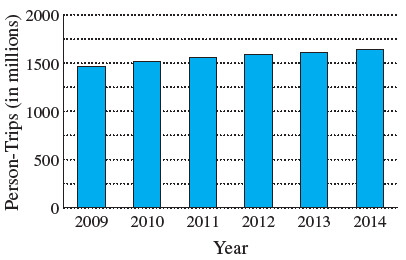
The bar graph shows numbers of leisure trips within the United States (in millions of person-trips of 50 or more miles one-way) over the years 2009–2014. The function
ƒ(t) = 1458 + 95.42 ln t, t ≥ 1,
where t represents the number of years since 2008 and ƒ(t) is the number of person-trips, in millions, approximates the curve reasonably well.
Use the function to approximate the number of person-trips in 2012 to the nearest million. How does this approximation compare to the actual number of 1588 million?
U.S. Domestic Leisure Travel Volume
Fantastic news! We've Found the answer you've been seeking!
Step by Step Answer:
The year 2012 is represented by t 4 ...View the full answer

Answered By
Moses mwangi
With prior writing experience, be sure that I will give a great grade, If not an A+, it will be something close to this. My reviews speaks it all, Try me!!
78+ Reviews
157+ Question Solved
Related Book For 

College Algebra
ISBN: 978-0134697024
12th edition
Authors: Margaret L. Lial, John Hornsby, David I. Schneider, Callie Daniels
Question Posted:
