

The data in the table below represent the U.S. online advertising revenues for the years 20052016. (a)
Question:
The data in the table below represent the U.S. online advertising revenues for the years 2005–2016.
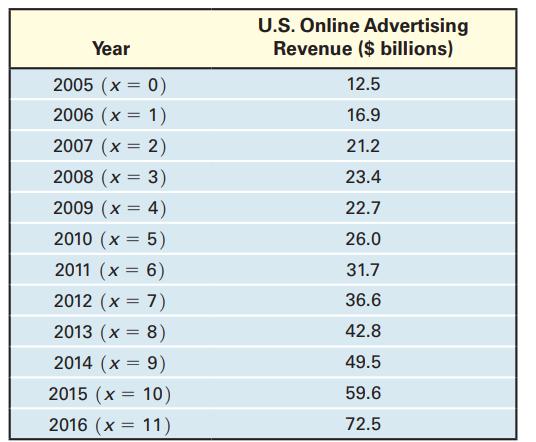
(a) Using a graphing utility, draw a scatter plot of the data using 0 for 2005, 1 for 2006, and so on as the independent variable, and online advertising revenue as the dependent variable.
(b) Based on the scatter plot drawn in part (a), decide what model (linear, quadratic, cubic, exponential, logarithmic, or logistic) that you think best describes the relation between year and revenue.
(c) Using a graphing utitlity, find the model of best fit.
(d) Using a graphing utility, graph the function found in part (c) on the scatter plot drawn in part (a).
(e) Use your model to predict the online advertising revenue in 2021.
Fantastic news! We've Found the answer you've been seeking!
Step by Step Answer:
a b c d e N...View the full answer

Answered By
Joseph Mwaura
I have been teaching college students in various subjects for 9 years now. Besides, I have been tutoring online with several tutoring companies from 2010 to date. The 9 years of experience as a tutor has enabled me to develop multiple tutoring skills and see thousands of students excel in their education and in life after school which gives me much pleasure. I have assisted students in essay writing and in doing academic research and this has helped me be well versed with the various writing styles such as APA, MLA, Chicago/ Turabian, Harvard. I am always ready to handle work at any hour and in any way as students specify. In my tutoring journey, excellence has always been my guiding standard.
1+ Reviews
10+ Question Solved
Related Book For 

Question Posted:
