

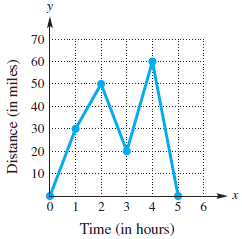
The graph depicts the distance y that a person driving a car on a straight road is
Question:
The graph depicts the distance y that a person driving a car on a straight road is from home after x hours. Interpret the graph. At what speeds did the car travel?
Distance from Home
Fantastic news! We've Found the answer you've been seeking!
Step by Step Answer:
Initially the car is at home After traveling for 30 mph for 1 hr the car is 30 mi aw...View the full answer

Answered By
Carly Cimino
As a tutor, my focus is to help communicate and break down difficult concepts in a way that allows students greater accessibility and comprehension to their course material. I love helping others develop a sense of personal confidence and curiosity, and I'm looking forward to the chance to interact and work with you professionally and better your academic grades.
12+ Reviews
21+ Question Solved
Related Book For 

College Algebra
ISBN: 978-0134697024
12th edition
Authors: Margaret L. Lial, John Hornsby, David I. Schneider, Callie Daniels
Question Posted:
