

The graph of a function is shown in the figure. Sketch the graph of each function
Question:
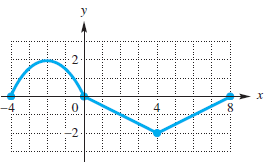
The graph of a function ƒ is shown in the figure. Sketch the graph of each function defined as follows.
(a) y = ƒ(x) + 3
(b) y = ƒ(x - 2)
(c) y = ƒ(x + 3) - 2
(d) y = |ƒ(x)|
Fantastic news! We've Found the answer you've been seeking!
Step by Step Answer:
a To graph y f x 3 translate the graph of y fx 3 units up b To graph y ...View the full answer

Answered By
Ehsan Mahmood
I’ve earned Masters Degree in Business Studies and specialized in Accounts & Finance. Couple with this, I have earned BS Sociology from renowned institute of Pakistan. Moreover, I have humongous teaching experience at Graduate and Post-graduate level to Business and humanities students along with more than 7 years of teaching experience to my foreign students Online. I’m also professional writer and write for numerous academic journals pertaining to educational institutes periodically.
248+ Reviews
287+ Question Solved
Related Book For 

College Algebra
ISBN: 978-0134697024
12th edition
Authors: Margaret L. Lial, John Hornsby, David I. Schneider, Callie Daniels
Question Posted:
