

The graph shows egg production in millions of eggs in selected states for 2015 and 2016. Use
Question:
The graph shows egg production in millions of eggs in selected states for 2015 and 2016. Use this graph to work each problem.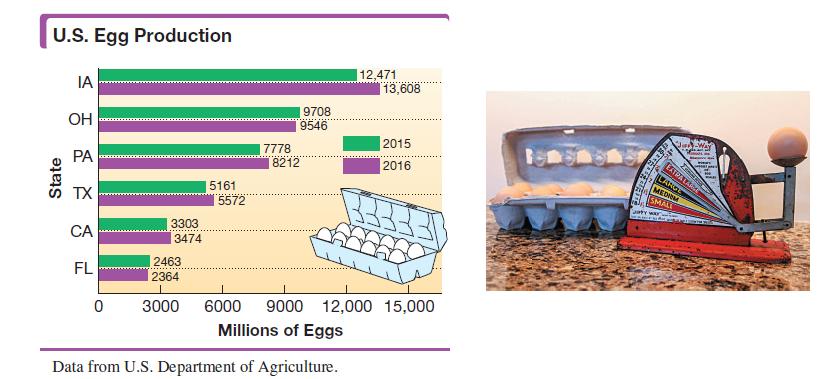
In 2016, which states had production greater than 6000 million eggs?
Fantastic news! We've Found the answer you've been seeking!
Step by Step Answer:
After reviewing the graph it can be stated that there w...View the full answer

Answered By
PAUL KAMUNGU
I have been working as a tutor for last 2 years. I have served on platforms like courshero, chegg, mathmaster and photomath
0 Reviews
10+ Question Solved
Related Book For 

Intermediate Algebra
ISBN: 9780134895987
13th Edition
Authors: Margaret Lial, John Hornsby, Terry McGinnis
Question Posted:
