

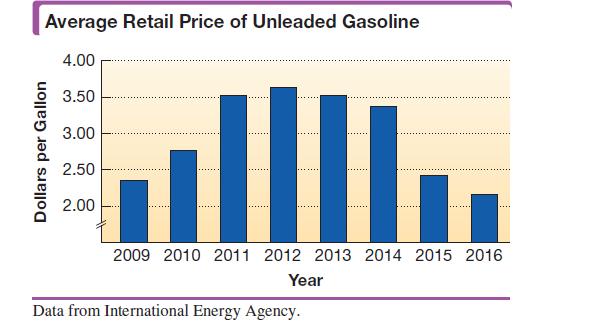
The graph shows how the average retail price (in dollars per gallon) of regular unleaded gasoline in
Question:
The graph shows how the average retail price (in dollars per gallon) of regular unleaded gasoline in the United States changed between 2009 and 2016. The graph suggests that a quadratic function would be a good fit to the data. The data are approximated by the function
![]()
In the model, x = 0 represents 2009, x = 1 represents 2010, and so on.
(a) How could we have predicted that this quadratic model would have a negative coefficient for x2, based only on the graph shown?
(b) Algebraically determine the vertex of the graph, with coordinates rounded to the nearest hundredth. Interpret the answer as it applies to this application.
Fantastic news! We've Found the answer you've been seeking!
Step by Step Answer:
a Based on the graph shown if the quadratic model fits the data well we can observe that the price o...View the full answer

Answered By
User l_917591
As a Business Management graduate from Moi University, I had the opportunity to work as a tutor for undergraduate students in the same field. This experience allowed me to apply the theoretical knowledge I had gained in a practical setting, while also honing my teaching and communication skills.
As a tutor, I was responsible for conducting tutorial sessions, grading assignments and exams, and providing feedback and support to my students. I also assisted with the preparation of course materials and collaborated with other tutors and professors to ensure consistency in teaching and assessment.
0 Reviews
10+ Question Solved
Related Book For 

Intermediate Algebra
ISBN: 9780134895987
13th Edition
Authors: Margaret Lial, John Hornsby, Terry McGinnis
Question Posted:
