

The graph shows the number of U.S. travelers to Canada (in thousands) from 2000 through 2016. (a)
Question:
The graph shows the number of U.S. travelers to Canada (in thousands) from 2000 through 2016.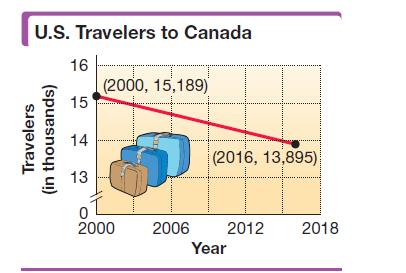
(a) Use the given ordered pairs to find the average rate of change in the number of U.S. travelers to Canada per year during this period. Round the answer to the nearest thousand.(b) Explain how a negative slope is interpreted in this situation.
Fantastic news! We've Found the answer you've been seeking!
Step by Step Answer:
a To find the average rate of change in the number of US travelers to Canada per year during t...View the full answer

Answered By
Diana Muriuki
As an online math tutor, I have several years of hands-on experience working with students of all ages and skill levels. I hold a Bachelor's degree in Mathematics and a Master's degree in Education. Additionally, I have completed multiple training courses in online teaching and tutoring methods.
Throughout my career, I have worked with students in both individual and group settings, including classroom teaching, after-school tutoring, and online instruction. I am proficient in teaching a wide range of math topics, from basic arithmetic to advanced calculus and statistics.
One of my greatest strengths as a tutor is my ability to adapt my teaching style to meet the unique needs and learning styles of each individual student. I understand that every student is different, and I strive to create a comfortable and supportive learning environment that encourages growth and development.
In addition to my formal education and tutoring experience, I am also a lifelong learner with a passion for mathematics. I am constantly seeking out new resources and methods to improve my own knowledge and skills, and I believe this passion and enthusiasm helps to inspire my students as well.
Overall, my hands-on experience and proficiency as a math tutor are grounded in a combination of formal education, practical experience, and a genuine love of mathematics. I am confident in my ability to help students achieve their goals and succeed in math, and I look forward to the opportunity to work with new students and continue to grow as an educator.
0 Reviews
10+ Question Solved
Related Book For 
Intermediate Algebra
ISBN: 9780134895987
13th Edition
Authors: Margaret Lial, John Hornsby, Terry McGinnis
Question Posted:
