

The graph shows water in a swimming pool over time. (a) What numbers are possible values of
Question:
The graph shows water in a swimming pool over time.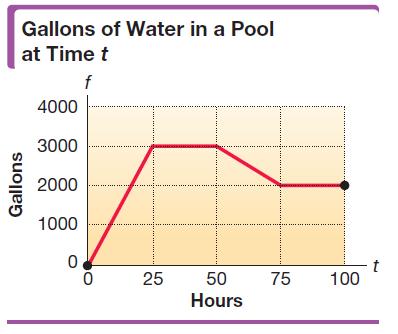
(a) What numbers are possible values of the independent variable? The dependent variable?(b) For how long is the water level increasing? Decreasing?(c) How many gallons of water are in the pool after 90 hr?(d) Call this function ƒ. What is ƒ(0)? What does it mean?(e) What is ƒ(25)? What does it mean?
Fantastic news! We've Found the answer you've been seeking!
Step by Step Answer:
a The time in hours Here 0 25 50 75 and 100 hours are independe...View the full answer

Answered By
PRITAM SINGH
I have completed my Bachelors degree in 2021 in the subject Chemistry from Cotton University located in Guwahati. At present, I am pursuing my Masters degree in Chemistry at the same University and I'm in my final year now. I have good knowledge in the field of chemicals and procedures regarding this Subject and I also feel quite comfortable in Math, especially Algebra. I don't have much teaching experience but I am quite confident and fired up to tutor students in my field of expertise.
0 Reviews
10+ Question Solved
Related Book For 
Intermediate Algebra
ISBN: 9780134895987
13th Edition
Authors: Margaret Lial, John Hornsby, Terry McGinnis
Question Posted:
