

The number (in thousands) of new, privately owned housing units completed in the United States is shown
Question:
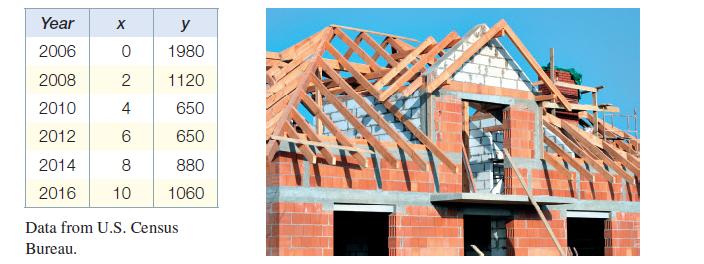
The number (in thousands) of new, privately owned housing units completed in the United States is shown in the table. Here x represents the number of years since 2006, and y represents total housing units completed.
(a) Use the ordered pairs (x, y) to make a scatter diagram of the data.
(b) Would a linear or a quadratic function better model the data?
(c) Should the coefficient a of x2 in a quadratic model y = ax2 + bx + c be positive or negative?
(d) Use the ordered pairs (0, 1980), (4, 650), and (8, 880) to find a quadratic function that models the data.
(e) Use the model from part (d) to approximate the number of such housing units (in thousands) completed in 2008 and 2012. How well does the model approximate the actual data from the table?
Step by Step Answer:
Solution a To make a scatter diagram of the data we plot the ordered pairs x y 0 1980 2 1120 4 650 6 ...View the full answer


Intermediate Algebra
ISBN: 9780134895987
13th Edition
Authors: Margaret Lial, John Hornsby, Terry McGinnis
