

Total spending (in billions of dollars) in the United States from all sources on physician and clinical
Question:
Total spending (in billions of dollars) in the United States from all sources on physician and clinical services for the years 2000–2016 are shown in the bar graph. One model for the data is the quadratic function
![]()
Here, x = 0 represents 2000, x = 2 represents 2002, and so on. Use the graph and the model to work each of the following exercises.
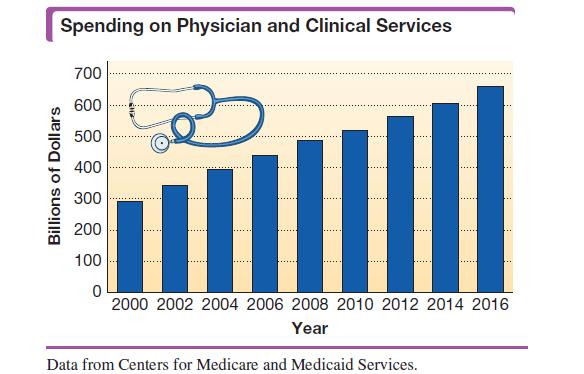
Approximate spending on physician and clinical services in 2014 to the nearest $10 billion using
(a) The graph
(b) The model
How do the two approximations compare?
Fantastic news! We've Found the answer you've been seeking!
Step by Step Answer:
As we have one model for the data is the quadratic function fx 02901...View the full answer

Answered By
Rishi Anand
Hello and welcome to my profile.Let me introduce myself.I am Laiba Ayyub.I am Master degree holder.I got my Masters degree in Mathematics from Riphah International University Islamabad.I have been a good student.I am teaching many students right now.I taught in a High private school in my city.I also take classes in evening from class 8th to 14th.I am expert in doing maths.I believe in students satisfaction.
0 Reviews
10+ Question Solved
Related Book For 

Intermediate Algebra
ISBN: 9780134895987
13th Edition
Authors: Margaret Lial, John Hornsby, Terry McGinnis
Question Posted:
