

Use the graph shown in FIGURE 1 at the beginning of this section (and repeated here) to
Question:
Use the graph shown in FIGURE 1 at the beginning of this section (and repeated here) to work each exercise.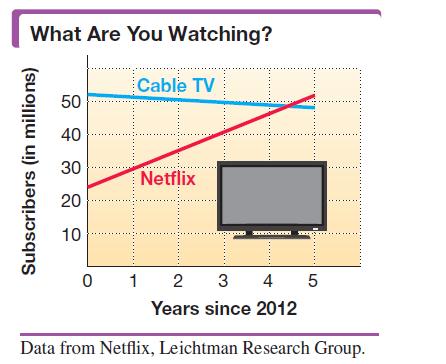
Interpret the answer for Exercise 87, rounding down for the year. How does this compare to the estimate from Exercise 86?
Data from in Exercise 86 & 87
Between which two years were the numbers of Netflix and cable TV subscribers the same? About how many people subscribed to each video content provider at that point?
If x = 0 represents 2012 and x = 5 represents 2017, the number of subscribers y in millions can be modeled by the linear equations in the following system.
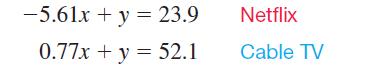
Solve this system. Express values as decimals rounded to the nearest tenth. Write the solution as an ordered pair of the form (year, number of subscribers).
Step by Step Answer:
We have to solve the following system of equations 561x y 239 Eq1 ...View the full answer


Intermediate Algebra
ISBN: 9780134895987
13th Edition
Authors: Margaret Lial, John Hornsby, Terry McGinnis
