

Table 1 gives the percentage of U.S. adults who at least occasionally used the Internet in the
Question:
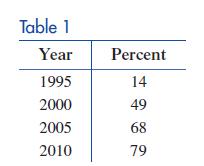
Table 1 gives the percentage of U.S. adults who at least occasionally used the Internet in the given year.
The following transition matrix P is proposed as a model for the data, where I represents the population of Internet users.
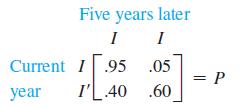
(A) Let S0 = [.14 .86] and find S1, S2, and S3. Compute both matrices exactly and then round entries to two decimal places.
(B) Construct a new table comparing the results from part (A) with the data in Table 1.
(C) According to this transition matrix, what percentage of the adult U.S. population will use the Internet in the long run?
Fantastic news! We've Found the answer you've been seeking!
Step by Step Answer:
ANSWER A Using the transition matrix P given we can compute S1 S2 and S3 as follows S1 S0P 14 86 05 ...View the full answer

Answered By
Aketch Cindy Sunday
I am a certified tutor with over two years of experience tutoring . I have a passion for helping students learn and grow, and I firmly believe that every student has the potential to be successful. I have a wide range of experience working with students of all ages and abilities, and I am confident that I can help students succeed in school.
I have experience working with students who have a wide range of abilities. I have also worked with gifted and talented students, and I am familiar with a variety of enrichment and acceleration strategies.
I am a patient and supportive tutor who is dedicated to helping my students reach their full potential. Thank you for your time and consideration.
0 Reviews
10+ Question Solved
Related Book For 

College Mathematics For Business Economics, Life Sciences, And Social Sciences
ISBN: 978-0134674148
14th Edition
Authors: Raymond Barnett, Michael Ziegler, Karl Byleen, Christopher Stocker
Question Posted:
