

The following table gives the U.S. population per square mile for the years 19602010: (A) Find the
Question:
The following table gives the U.S. population per square mile for the years 1960–2010:
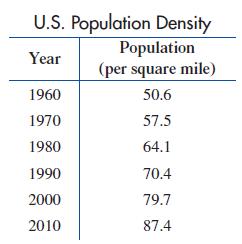
(A) Find the least squares line for the data, using x = 0 for 1960.
(B) Use the least squares line to estimate the population density in the United States in the year 2025.
(C) Now use quadratic regression and exponential regression to obtain the estimate of part (B).
Fantastic news! We've Found the answer you've been seeking!
Step by Step Answer:
Solution A Find the least squares line for the data using x 0 for 1960 First replace x with 0 to get ...View the full answer

Answered By
Labindao Antoque
I graduated in 2018 with a Bachelor of Science degree in Psychology from Dalubhasaan ng Lungsod ng San Pablo. I tutored students in classes and out of classes. I use a variety of strategies to tutor students that include: lecture, discussions about the subject matter, problem solving examples using the principles of the subject matter being discussed in class , homework assignments that are directed towards reinforcing what we learn in class , and detailed practice problems help students to master a concept. I also do thorough research on Internet resources or textbooks so that I know what students need to learn in order to master what is being taught in class .
0 Reviews
10+ Question Solved
Related Book For 

College Mathematics For Business Economics, Life Sciences, And Social Sciences
ISBN: 978-0134674148
14th Edition
Authors: Raymond Barnett, Michael Ziegler, Karl Byleen, Christopher Stocker
Question Posted:
