

The U.S. Consumer Price Index (CPI) in recent years is given in Table 3. A scatter plot
Question:
The U.S. Consumer Price Index (CPI) in recent years is given in Table 3. A scatter plot of the data and linear regression line are shown in the figure, where x represents years since 2000.
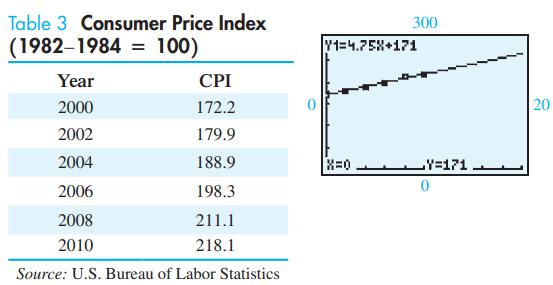
A). Interpret the slope of the model.
B). Predict the CPI in 2024.
Fantastic news! We've Found the answer you've been seeking!
Step by Step Answer:
Certainly Given the linear regression model equation Y 475X 171 where X represents years since 20...View the full answer

Answered By
Abhinav sharma
I am a mathematics tutor since 3 years . I like mathematics very much so I decided to teach students . For me teaching mathematics is just like doing my favorite work.
I have taught so many students and they are satisfied with my work.
I also give home tuitions in my area.
I can explain mathematics in a simple way, even the trickiest ones.
0 Reviews
10+ Question Solved
Related Book For 
College Mathematics For Business Economics Life Sciences And Social Sciences
ISBN: 9780321945518
13th Edition
Authors: Raymond Barnett, Michael Ziegler, Karl Byleen
Question Posted:
