

Construct the position graph for the subway shuttle train as shown in Figure 2.18(a). Your graph should
Question:
Construct the position graph for the subway shuttle train as shown in Figure 2.18(a). Your graph should show the position of the train, in kilometers, from t = 0 to 20 s. You will need to use the information on acceleration and velocity given in the examples for this figure.
Data given in Figure 2.18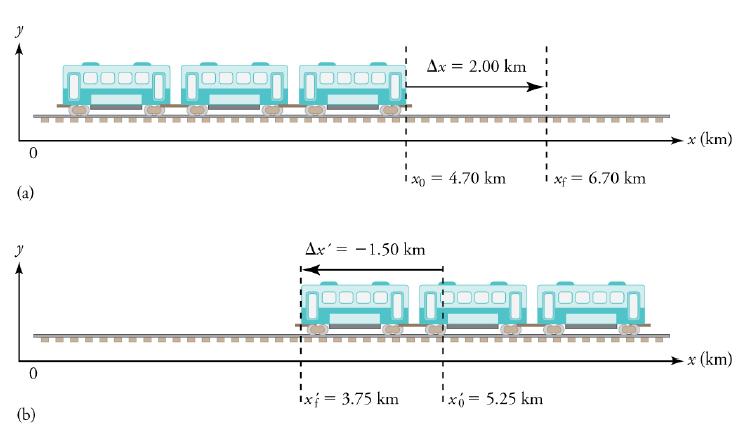
Fantastic news! We've Found the answer you've been seeking!
Step by Step Answer:
Position km 482 4...View the full answer

Answered By
Rustia Melrod
I am a retired teacher with 6 years of experience teaching various science subjects to high school students and undergraduate students. This background enables me to be able to help tutor students who are struggling with the science of business component of their education. Teaching difficult subjects has definitely taught me patience. There is no greater joy for me than to patiently guide a student to the correct answer. When a student has that "aha!" moment, all my efforts are worth it.
The Common Core standards are a useful yardstick for measuring how well students are doing. My students consistently met or exceeded the Common Core standards for science. I believe in working with each student's individual learning styles to help them understand the material. If students were struggling with a concept, I would figure out a different way to teach or apply that concept. I was voted Teacher of the Year six times in my career. I also won an award for Innovative Teaching Style at the 2011 National Teaching Conference.
4+ Reviews
10+ Question Solved
Related Book For 
Question Posted:
