

Figure 2.66 shows the position graph for a particle for 6 s. (a) Draw the corresponding Velocity
Question:
Figure 2.66 shows the position graph for a particle for 6 s.
(a) Draw the corresponding Velocity vs. Time graph.
(b) What is the acceleration between 0 s and 2 s?
(c) What happens to the acceleration at exactly 2 s?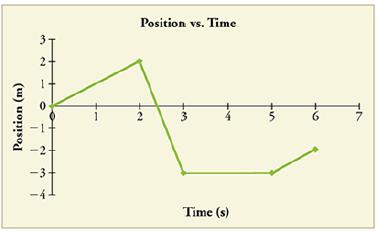
Fantastic news! We've Found the answer you've been seeking!
Step by Step Answer:
b Acceleration between 0 s and 2 s The acceleration of the particle between 0 s and 2 s can be calc...View the full answer

Answered By
Mercy Kangai
I provide creative and detailed administrative, web search, academic writing, data entry, Personal assistant, Content writing, Translation, Academic writing, editing and proofreading services. I excel at working under tight deadlines with strict expectations. I possess the self-discipline and time management skills necessary to have served as an academic writer for the past seven years. I can bring value to your business and help solve your administrative assistant issues. I have extensive experience in marketing and small business management.
27+ Reviews
82+ Question Solved
Related Book For 
Question Posted:
