

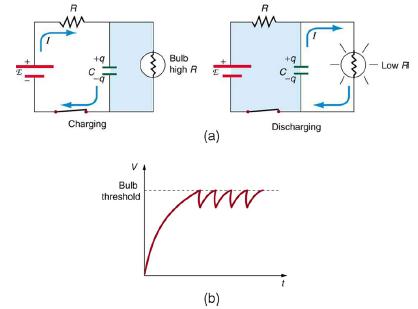
In Figure 21.40, does the graph indicate the time constant is shorter for discharging than for charging?
Question:
In Figure 21.40, does the graph indicate the time constant is shorter for discharging than for charging? Would you expect ionized gas to have low resistance? How would you adjust to get a longer time between flashes? Would adjusting R affect the discharge time?
Data given in Figure 21.40
Fantastic news! We've Found the answer you've been seeking!
Step by Step Answer:
Does the graph indicate the time constant is shorter for discharging than for charging Yesthe graph indicates that the time constant is shorter for di...View the full answer

Answered By
Charles Okinda
students should give all the instructions concerning the challenge that they face. they will get an immediate response because I am always online.
752+ Reviews
1477+ Question Solved
Related Book For 
Question Posted:
