

Referring to Figure 21.37, draw a graph of potential difference across the resistor versus time, showing at
Question:
Referring to Figure 21.37, draw a graph of potential difference across the resistor versus time, showing at least two intervals of . Also draw a graph of current versus time for this situation.
Data given in Figure 21.37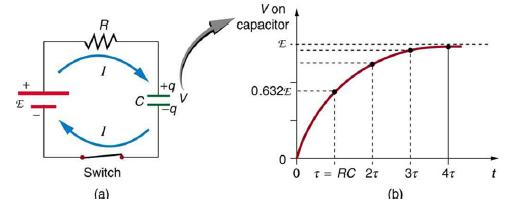
Fantastic news! We've Found the answer you've been seeking!
Step by Step Answer:
Graph of potential difference across the resistor versus time The potential difference across the resistor will initially be zerosince the switch is o...View the full answer

Answered By
Deborah Joseph
My experience has a tutor has helped me with learning and relearning. You learn everyday actually and there are changes that are made to the curriculum every time so being a tutor has helped in keeping me updated about the present curriculum and all.
I have also been able to help over 100 students achieve better grades particularly in the categories of Math and Biology both in their internal examinations and external examinations.
2+ Reviews
10+ Question Solved
Related Book For 
Question Posted:
