

Figure P15.10 is a history graph at x = 2 m of a wave moving to the
Question:
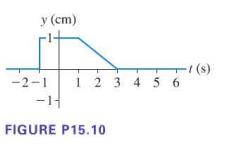
Figure P15.10 is a history graph at x = 2 m of a wave moving to the left at 1 m/s. Draw the snapshot graph of this wave at 1 = 0 s.
Fantastic news! We've Found the answer you've been seeking!
Step by Step Answer:
which shows the displacement in centimeters on the yaxis of a point at x 2 meters in a wave as a function of time in seconds on the taxis The graph in...View the full answer

Answered By
Muhammad Umair
I have done job as Embedded System Engineer for just four months but after it i have decided to open my own lab and to work on projects that i can launch my own product in market. I work on different softwares like Proteus, Mikroc to program Embedded Systems. My basic work is on Embedded Systems. I have skills in Autocad, Proteus, C++, C programming and i love to share these skills to other to enhance my knowledge too.
1+ Reviews
10+ Question Solved
Related Book For 

College Physics A Strategic Approach
ISBN: 9780321595492
2nd Edition
Authors: Randall D. Knight, Brian Jones, Stuart Field
Question Posted:
