

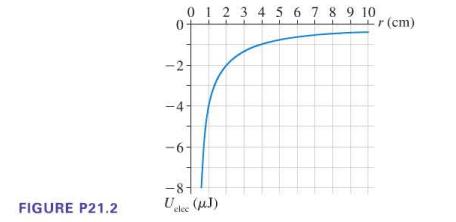
The graph in Figure P21.2 shows the electric potential energy as a function of separation for two
Question:
The graph in Figure P21.2 shows the electric potential energy as a function of separation for two point charges. If one charge is +0.44 nC, what is the other charge?
Fantastic news! We've Found the answer you've been seeking!
Step by Step Answer:
To find the other charge we can use the following equation U k q1 q2 r wher...View the full answer

Answered By
Charles mwangi
I am a postgraduate in chemistry (Industrial chemistry with management),with writing experience for more than 3 years.I have specialized in content development,questions,term papers and assignments.Majoring in chemistry,information science,management,human resource management,accounting,business law,marketing,psychology,excl expert ,education and engineering.I have tutored in other different platforms where my DNA includes three key aspects i.e,quality papers,timely and free from any academic malpractices.I frequently engage clients in each and every step to ensure quality service delivery.This is to ensure sustainability of the tutoring aspects as well as the credibility of the platform.
2+ Reviews
10+ Question Solved
Related Book For 
College Physics A Strategic Approach
ISBN: 9780321595492
2nd Edition
Authors: Randall D. Knight, Brian Jones, Stuart Field
Question Posted:
