

The graph in Figure Q21.6 shows the electric potential along the x-axis. Draw a graph of the
Question:
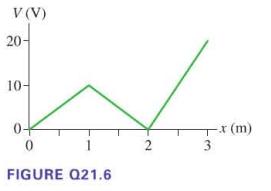
The graph in Figure Q21.6 shows the electric potential along the x-axis. Draw a graph of the potential energy of a 0.10 C charged particle in this region of space, providing a numerical scale on the energy axis.
Fantastic news! We've Found the answer you've been seeking!
Step by Step Answer:
To draw A graph of the potential energy of a 010 C charged particle in this region of ...View the full answer

Answered By
Fahmin Arakkal
Tutoring and Contributing expert question and answers to teachers and students.
Primarily oversees the Heat and Mass Transfer contents presented on websites and blogs.
Responsible for Creating, Editing, Updating all contents related Chemical Engineering in
latex language
8+ Reviews
22+ Question Solved
Related Book For 
College Physics A Strategic Approach
ISBN: 9780321595492
2nd Edition
Authors: Randall D. Knight, Brian Jones, Stuart Field
Question Posted:
