

The position graph of Figure P2.5 shows a dog slowly. sneaking up on a squirrel, then putting
Question:
The position graph of Figure P2.5 shows a dog slowly. sneaking up on a squirrel, then putting on a burst of speed.
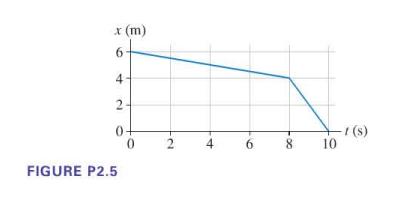
a. For how many seconds does the dog move at the slower speed?
b. Draw the dog's velocity-versus-time graph. Include a numerical scale on both axes.
Fantastic news! We've Found the answer you've been seeking!
Step by Step Answer:
a 8 seconds b Ti...View the full answer

Answered By
Ann Wangechi
hey, there, paying attention to detail is one of my strong points, i do my very best combined with passion. i enjoy researching since the net is one of my favorite places to be and to learn. i am a proficient and versatile blog, article academic and research writing i possess excellent English writing skills, great proof-reading. i am a good communicator and always provide feedback in real time. i'm experienced in the writing field, competent in computing, essays, accounting and research work and also as a Database and Systems Administrator
151+ Reviews
291+ Question Solved
Related Book For 
College Physics A Strategic Approach
ISBN: 9780321595492
2nd Edition
Authors: Randall D. Knight, Brian Jones, Stuart Field
Question Posted:
