

Figure P15.12 is a history graph at (x=2 mathrm{~m}) of a wave moving to the left at
Question:
Figure P15.12 is a history graph at \(x=2 \mathrm{~m}\) of a wave moving to the left at \(1 \mathrm{~m} / \mathrm{s}\). Draw the snapshot graph of this wave at \(t=0 \mathrm{~s}\).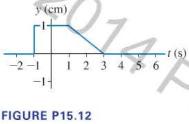
Step by Step Answer:

This question has not been answered yet.
You can Ask your question!
Related Book For 

College Physics A Strategic Approach
ISBN: 9780321907240
3rd Edition
Authors: Randall D. Knight, Brian Jones, Stuart Field
Question Posted:
