

Figure P2.19 shows the velocity graph of a bicycle. Draw the bicycle's acceleration graph for the interval
Question:
Figure P2.19 shows the velocity graph of a bicycle. Draw the bicycle's acceleration graph for the interval \(0 \mathrm{~s} \leq t \leq 4 \mathrm{~s}\). Give both axes an appropriate numerical scale.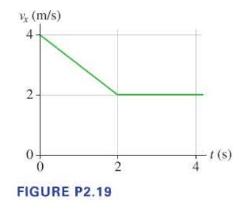
Fantastic news! We've Found the answer you've been seeking!
Step by Step Answer:
axlef...View the full answer

Answered By
YOGENDRA NAILWAL
As I'm a Ph.D. student, so I'm more focussed on my chemistry laboratory. I have qualified two national level exams viz, GATE, and NET JRF (Rank 68). So I'm highly qualified in chemistry subject. Also, I have two years of teaching experience in this subject, which includes college teacher as well as a personal tutor. I can assure you if you hire me on this particular subject, you are never going to regret it.
Best Regards.
1+ Reviews
10+ Question Solved
Related Book For 

College Physics A Strategic Approach
ISBN: 9780321907240
3rd Edition
Authors: Randall D. Knight, Brian Jones, Stuart Field
Question Posted:
